MENU

Support

Mobile Trading App

PC Trading App

Web Trading Platform

Download

Analysis and Education
Selected Ideas

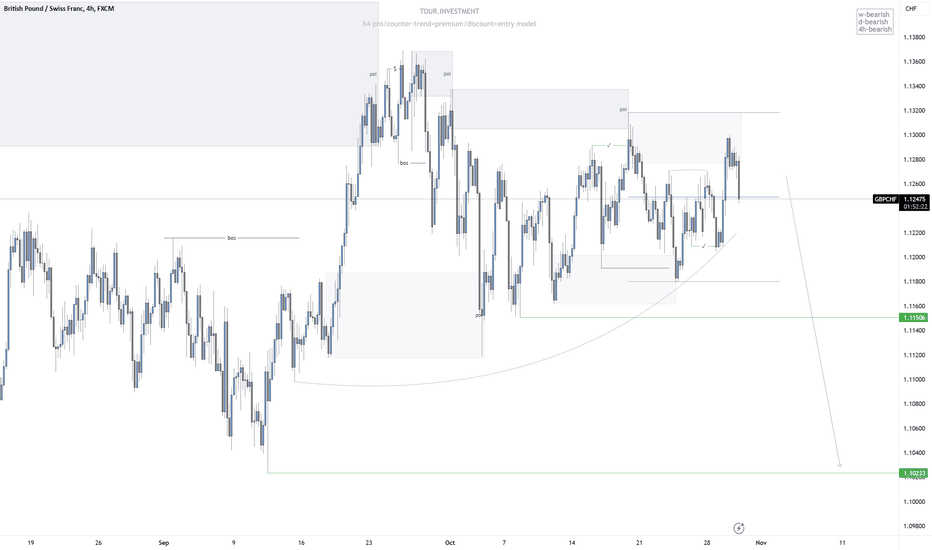
gbp/chf expect price to make a new low
GBPCHF ·
Wed Oct 30 11:07:39 UTC 2024
price respects the daily supply zone where price has made a 4h choch where I have then been able to mark a new 4h supply zone where I want to look for shorts Feedback
Details
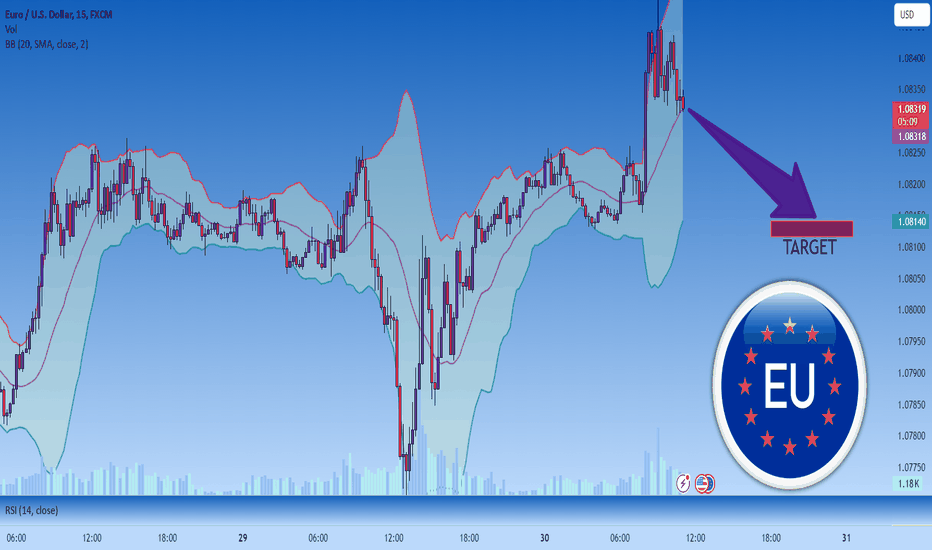
EURUSD: Strong Bearish Bias! Sell!
EURUSD ·
Wed Oct 30 11:09:52 UTC 2024
Welcome to our daily EURUSD prediction! We made our analysis today using SMC and ICT trading theories, which, combined with our trading experience all point to the downside. So we are locally bearish biased and the target for the short trade is 1.08141 Wish you good luck in trading to you all!
Details
Pre-elections Trend Continuation Bet
GBPUSD ·
Wed Oct 30 11:09:59 UTC 2024
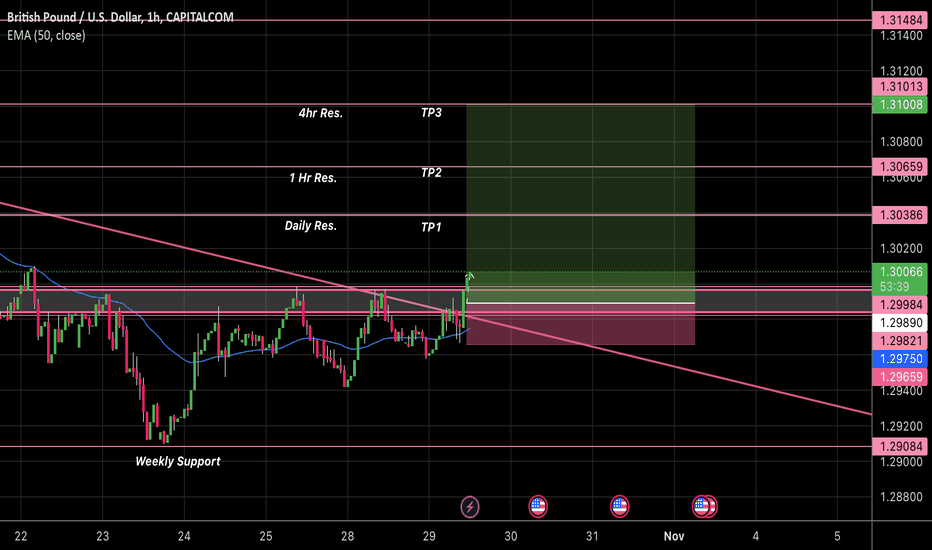
Fundamentals & Sentiment GBP: - COT - S&P PMI Miss USD: - Ec. data (esp. JOLTS) - Seasonality, pre-elections Technical & Other Setup: TC(RTF) Setup timeframe: 4h Trigger: 1h Medium-term: Down Long-term: Range Min target: Local low Stop loss: 0.18% Position size: 0.5 of the normal Risk Unit
Details
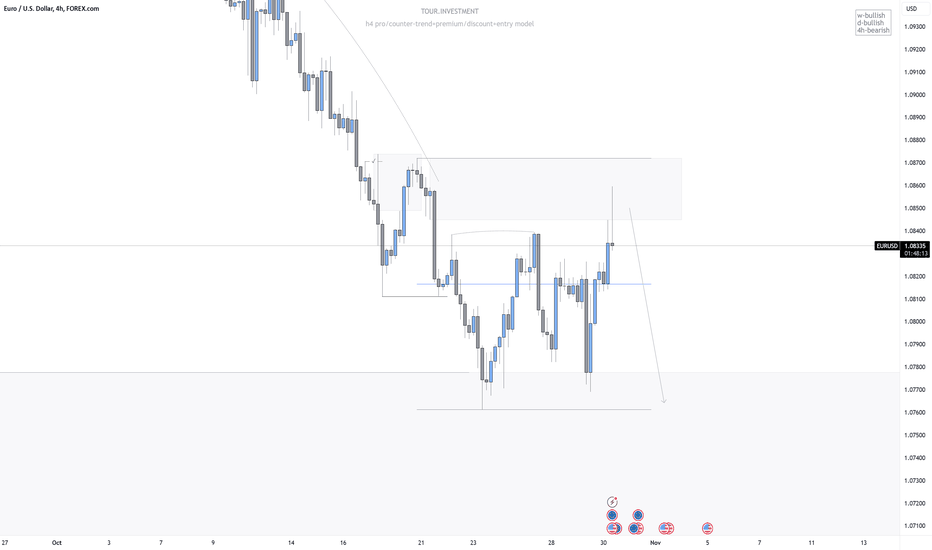
euro/usd new lower low?
EURUSD ·
Wed Oct 30 11:11:48 UTC 2024
price follows the 4h order flow, after seeing the break from the low I was able to mark a supply zone where price has ended up where I then want to look for shorts again to drive the price lower! Feedback
Details
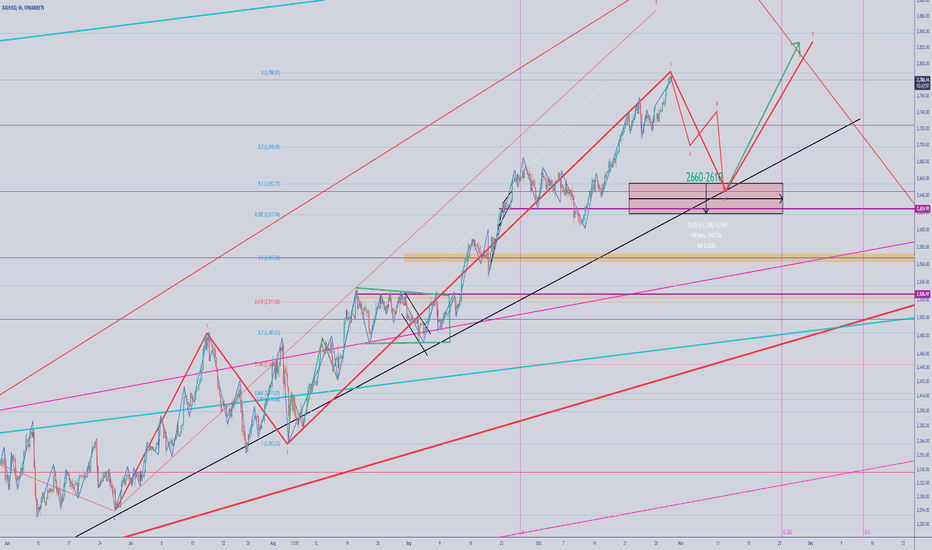
GOLD 4h
XAUUSD ·
Wed Oct 30 11:12:04 UTC 2024
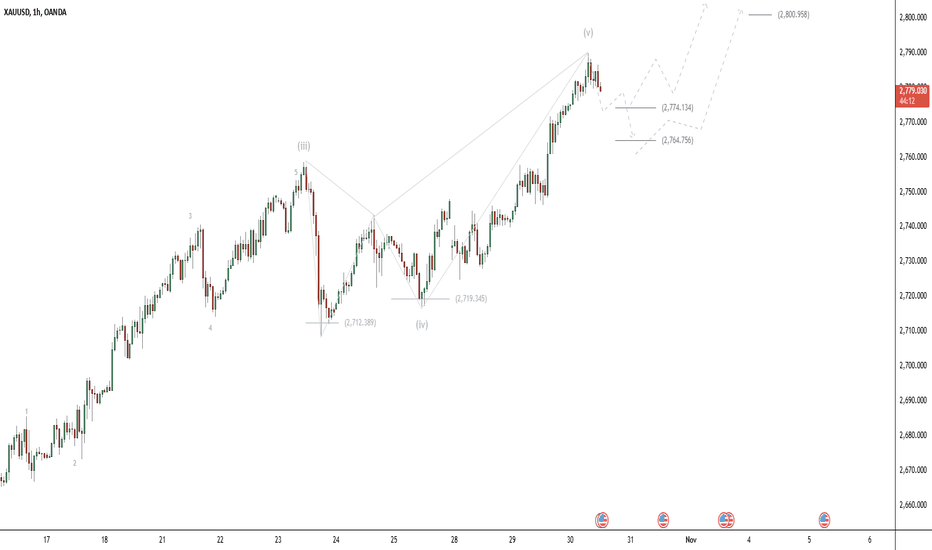
According to Elliot's wave counting conditions, we are probably currently waiting for the formation of wave 4 out of 5 out of 3 out of 5. The correction of this wave can continue until the range of 2660-2610 and after that the price will rise to create a new ceiling.
Details
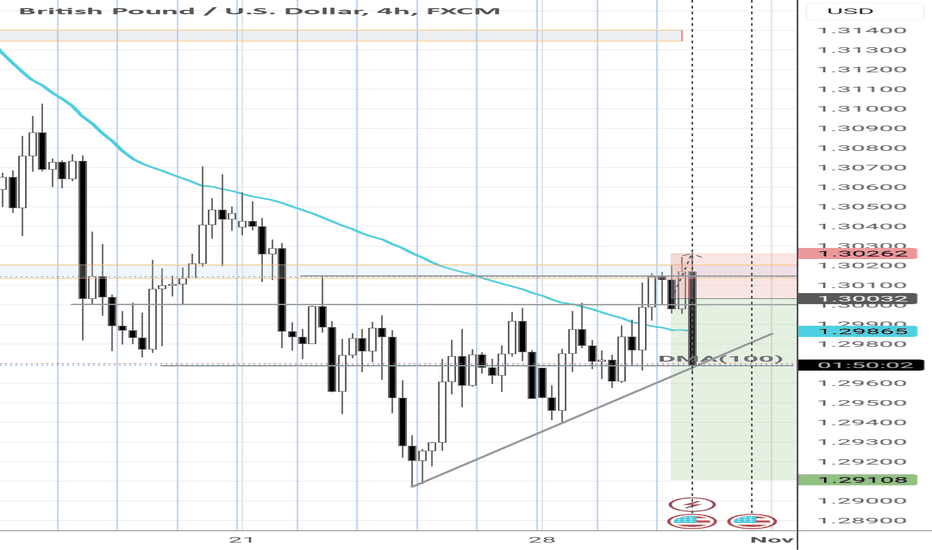
GBPUSD - FACING NEGATIVE MOMENTUM
GBPUSD ·
Wed Oct 30 11:12:33 UTC 2024
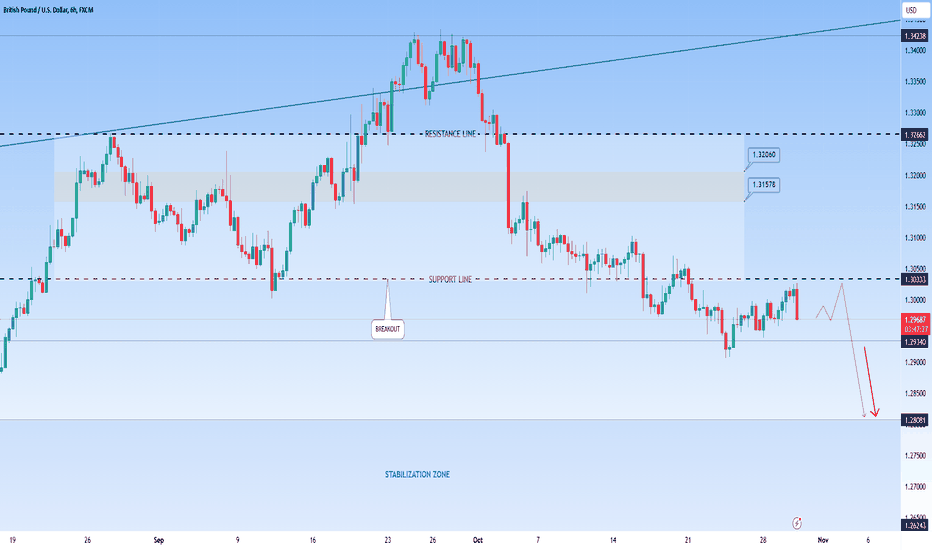
Generally, the direction is the downtrend and consolidation between 1.30333 and 1.29340. Uptrend Side: The uptrend will remain active if the price rises and stabilizes above 1.30333 with a 4H candle close, especially if it surpasses zones 1.31578 and 1.32060. Downtrend Side: The price is trading below 1.30333, targeting 1.29340 and 1.28081. A break beneath these...
Details

More…

Economic Calendar
04-2504-2604-2704-2804-29
  • Actual
  • Forecast
  • Prior
  • 00:30
    Tokyo Core CPI (YoY) (Apr)
    3.4%
    3.2%
    2.4%
  • 00:30
    CPI (YoY) (Apr)
    2.0%
    -
    1.1%
  • 00:30
    CPI Tokyo Ex Food and Energy (MoM) (Apr)
    0.7%
    -
    0.4%
  • 00:30
    Tokyo CPI (YoY) (Apr)
    3.5%
    -
    2.9%
  • 01:30
    URA Property Index (QoQ) (Q1)
    0.80%
    0.60%
    2.30%

More…

News

Swiss National Bank President Schlegel will speak in ten minutes.

News Flash25-04 07:50From XTrend Speed
Swiss National Bank President Schlegel will speak in ten minutes.

Thailand's Commerce Minister: Thailand will eventually be able to negotiate with the United States on tariff issues and get the best interests.

News Flash25-04 07:46From XTrend Speed
Thailand's Commerce Minister: Thailand will eventually be able to negotiate with the United States on tariff issues and get the best interests.

Indian Trade Minister: (Saying about domestic coke producers) Steel supply chain needs to be secured.

News Flash25-04 07:44From XTrend Speed
Indian Trade Minister: (Saying about domestic coke producers) Steel supply chain needs to be secured.

Indian Trade Minister: Steel safeguard tariffs have been implemented to prevent dumping.

News Flash25-04 07:42From XTrend Speed
Indian Trade Minister: Steel safeguard tariffs have been implemented to prevent dumping.

Indian Trade Minister: Working to strive for greater market access to steel products through free trade agreement negotiations.

News Flash25-04 07:32From XTrend Speed
Indian Trade Minister: Working to strive for greater market access to steel products through free trade agreement negotiations.

Hong Kong stock Xintai Medical (02291.HK) rose in the short term, once rising by more than 24%, with a turnover of about HK$180 million.

News Flash25-04 07:31From XTrend Speed
Hong Kong stock Xintai Medical (02291.HK) rose in the short term, once rising by more than 24%, with a turnover of about HK$180 million.

More…

  • How to use credit

    NEW

  • How to complete "About You"?

Trading Knowledge

Trading Terminology

Basic Knowledge
Open Positions: refer to the state of a trade after a trader has entered the market. Traders can Buy or Sell to enter the market. Closed Positions: refers to executing a security transaction that is the exact opposite of an open position, thereby nullifying it and eliminating the initial exposure. Close Out: When your account's Equity reaches 50% of your Used margin , the system will automatically close out positions. The system will start closing positions that have the highest loss until the ratio is greater than 50%. IMPORTANT NOTE: You should set “stop loss” and “take profit” in time when trading.

How to calculate profit and loss?

Product Guide
Profit/Loss = Price Difference in pips * Pip Value For example, you buy 100 AUDUSD with a pip value of 0.01 USD and required margin of $5. The opening price is 0.78260 and the closing price is 0.78220. Their price difference in pips is -4 pips [(0.78220-0.78260)/0.0001 - The pip for AUDUSD is the fourth decimal point, ie. 0.0001]. Hence, the profit/loss (P/L) is -$0.04.

What is Margin Level?

Product Guide
● The margin level is a risk management gauge that helps you understand how the currently opened positions influence your account. ● Margin level is a mathematical equation that effectively tells the trader how much of their funds are available for new trades ● The higher the margin level, the higher the amount of cash available to trade ● The lower the margin level, the lower the amount of cash available to trade and the account could be subject to a margin call. ● Monitoring margin level is important for managing your account. If it falls to 100% the system will not allow you to open new positions, and in the case it falls further, some of your positions may be forcibly closed. You can raise it, either by adding funds to your account to increase equity or by closing some positions to reduce used margin. If your margin level is getting close to 50%, you are in danger of having some of your positions forcibly closed. When the margin level is less than or equal to 50%, the positions with the greater losses will be closed out until the margin level rises above 50%. The positions opened by coupons will not be influenced and hence coupon trades will not be closed out. How is margin level calculated? It is calculated by the following formula: Margin level = (equity ÷ used margin) × 100% If you don't have any trades open, your margin level will be “- “ Margin level example If your account equity is $8,000 and your used margin is $2,000 then your margin level is 400%.

Important Economic Data - Released Dates

Economic Calendar
NFP: At 15:30 (GMT +2) on the first Friday of every month GDP of major currencies (EUR, USD, GBP, AUD, NZD & JPY): Released on a quarterly basis. CPI of major currencies (EUR, USD, GBP, AUD, NZD & JPY) : Released monthly. U.S. Initial jobless Claims : At 15:30 (GMT +2) every Thursday U.S. Durable Goods Orders : At 14:30 (GMT + 2) once a month FOMC Minutes: The Committee meets eight times a year, approximately once every 6 weeks EIA: At 17:30 (GMT + 2) every Wednesday OPEC meeting: Twice in a year, usually in June and December

Candlestick Chart

Candlestick Chart
There are two basic candlesticks: 1. Bullish Candle: When the close is higher than the open (usually green or white). 2. Bearish Candle: When the close is lower than the open (usually red or black). There are three main parts to a candlestick: 1. Upper Shadow: The vertical line between the high of the day and the close (bullish candle) or open (bearish candle). 2. Real Body: The difference between the open and close; colored portion of the candlestick. 3. Lower Shadow: The vertical line between the low of the day and the open (bullish candle) or close (bearish candle). Candlestick Patterns 1.White Marubozu Formation: When the opening price equals the bottom price and the closing price equals the top price. The body colour is white or green without shadows. Meaning: The buyers maintained control of the price - Bullish. Forecast: It indicates the continuation at the end of an uptrend or a reversal at the end of a downtrend. 2.Black Marubozu Formation: When the opening price equals the top price and the closing price equals the bottom price. The body colour is black or red without shadows. Meaning: The sellers maintained control of the price - Bearish Forecast: It indicates the continuation at the end of a downtrend or a reversal at the end of an uptrend. 3.Closing Black Marubozu Formation: When the closing price equals the top price and no lower shadow is created. Meaning: The sellers took control of the price - Bearish. Forecast: It indicates the continuation at the end of a downtrend or a reversal at the end of an uptrend. 4.Hammer Formation: Small candlestick body with a long lower shadow and a short or absent upper shadow. Meaning: The buyers were able to overcome the selling pressure and close near the open - Bullish. Forecast: It indicates a reversal after a downtrend or a support level which requires further bullish confirmation. 5.Shooting Star Formation: Small candlestick body with a long upper shadow and a short or absent lower shadow. Meaning: The sellers were able to overcome the buying pressure - Bearish. Forecast: It indicates a reversal after an uptrend or a resistance level which requires further bearish confirmation. 6.Spinning Tops Formation: Small candlestick body with a long upper shadow and a long lower shadow. Meaning: Neither the sellers or the buyers were able to take over - Neutral. Forecast: If it forms during an uptrend, it could mean that not many buyers are left and a possible reversal might occur. If it forms during a downtrend, it could mean that not many sellers are left and a possible reversal might occur. 7.Doji Formation: Opening and closing prices are effectively equal with a long upper shadow and a long lower shadow. Meaning: Neither the sellers or the buyers were able to take over - Neutral. Forecast: It indicates indecision and is often formed during resting periods after a significant move either higher or lower. The above are some types of candlestick patterns that can be formed. The different types can be categorised as single, double and triple candlestick formations. Please always take market conditions and price action signal into consideration before acting on a single candlestick pattern.

More…